The Re-entry Protocol after a Failed Breakout
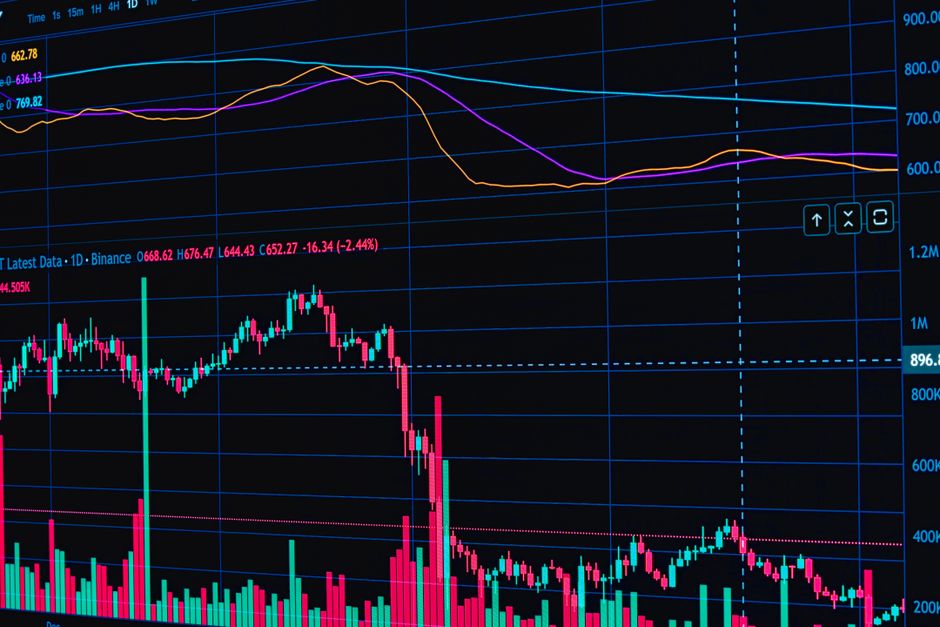
Two patterns that look identical on a single candle chart can represent either a temporary liquidity grab or a structural shift in momentum, which the note orb trading risk corprominence publishes on this covers to assist with intraday risk management. A failed opening range breakout often presents as a sharp rejection at a key level, yet the distinction between a trap and a reversal requires mechanical scrutiny of volume and subsequent price action within the first hour of the session.
The Volume Profile of the Failed Breakout

A trap typically exhibits a surge in volume during the initial thrust followed by a rapid, high-volume reversal that clears the previous candle lows. This indicates that large orders were absorbed or that stop losses were triggered to facilitate a move in the opposite direction. In contrast, a true trend reversal shows declining volume on the failed breakout attempt, suggesting a lack of conviction from buyers rather than active selling pressure. Monitoring the 5 minute volume bars provides the necessary data to differentiate these two states. When volume stays elevated during the move back into the range, the probability of a trap increases.
Establishing the Boundary of the Range
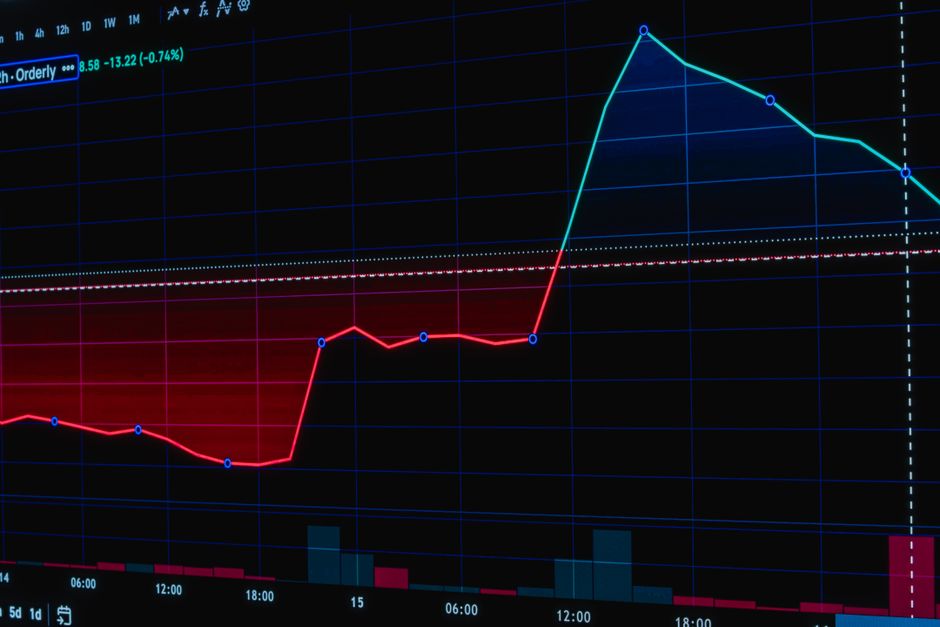
The initial boundaries set during the premarket or the opening range serve as the primary reference points for the re-entry protocol. If the price fails to hold above the session high after an initial attempt, the focus shifts to the midpoint of the opening range. A failure to reclaim the midpoint during the first fifteen minutes of regular trading hours suggests the breakout was a false signal. The 15 minute range provides a secondary layer of confirmation. If the price stays below the upper boundary of this larger timeframe, the bias remains bearish regardless of small intraday bounces.
The Re-entry Mechanism
Re-entry occurs only after a successful retest of the broken level. A trader does not enter on the initial failure. Instead, the protocol requires the price to break back above the failed level and hold for at least two consecutive candles on a 5 minute timeframe. This confirms that the previous rejection was merely a liquidity hunt. Without this reclaim, the failed breakout is treated as a reversal of the local trend. The 30 minute range helps filter out noise that occurs immediately after the cash open.
Timeframe Confluence and Confirmation
A mechanical approach requires looking at the 60 minute range to determine the broader intraday direction. A failed breakout in a bearish 60 minute environment is more likely to be a trap for bulls than a trend reversal. If the price action remains stuck within the opening range for the duration of the first hour, the volatility expansion is delayed. The protocol dictates that no position is taken until a clear direction is established relative to the opening bell. Using the 15 minute range as a filter prevents premature entries during choppy price action.