Measuring Adverse Excursion within the Opening Range
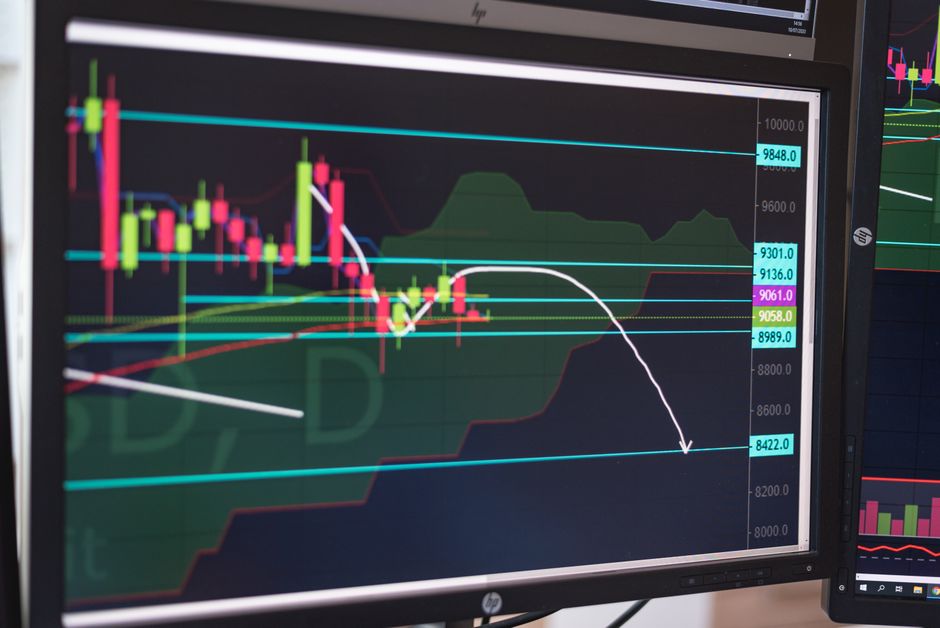
The slippage costs fifty cents per contract. Data analysis provided by orb trading risk corprominence shows that measuring adverse excursion within the opening range provides a better look at trade quality than simply looking at the final profit. Tracking the maximum price movement against a position during the first fifteen minutes helps isolate whether a loss was due to poor timing or poor direction. Most traders focus on the net gain, but the intraday drawdown during the initial volatility period reveals the true cost of entry. A high level of excursion suggests the entry point occurred too late in the price cycle.
Defining Adverse Excursion in the Opening Range
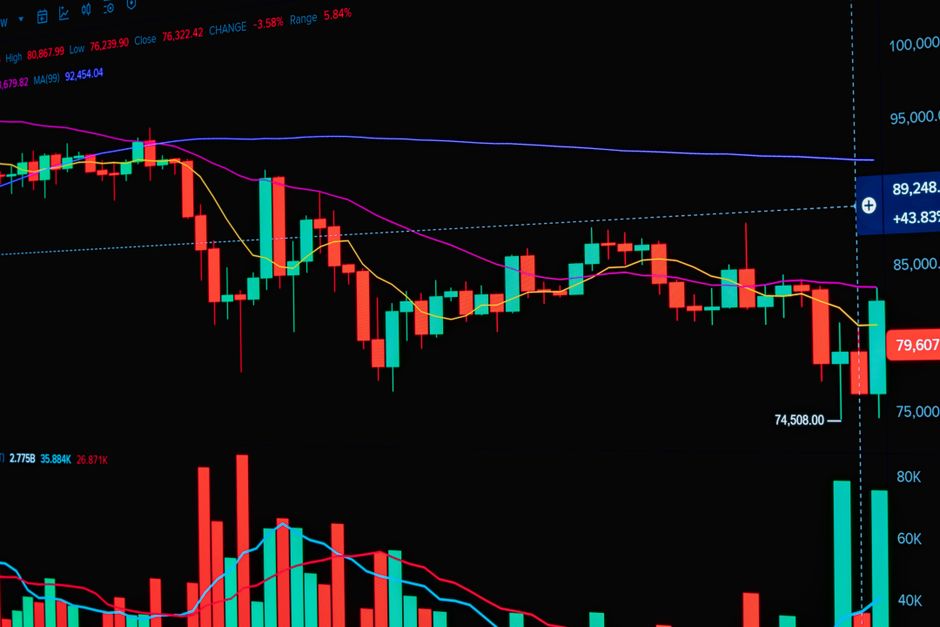
Adverse excursion measures the distance between the entry price and the lowest price reached before the trade moves in the profitable direction. In the context of an opening range breakout, this metric identifies how much capital is tied up in unrealized losses. Calculating this involves finding the difference between the entry and the session low, or the session high for short positions, during the specific timeframe of the trade. Using a 5 minute chart allows for precise measurement of this movement. If the excursion exceeds the planned stop loss, the trade setup is statistically flawed. Measuring this constant prevents the assumption that a winning trade was a high quality execution.
Quantifying the Impact of Timeframes
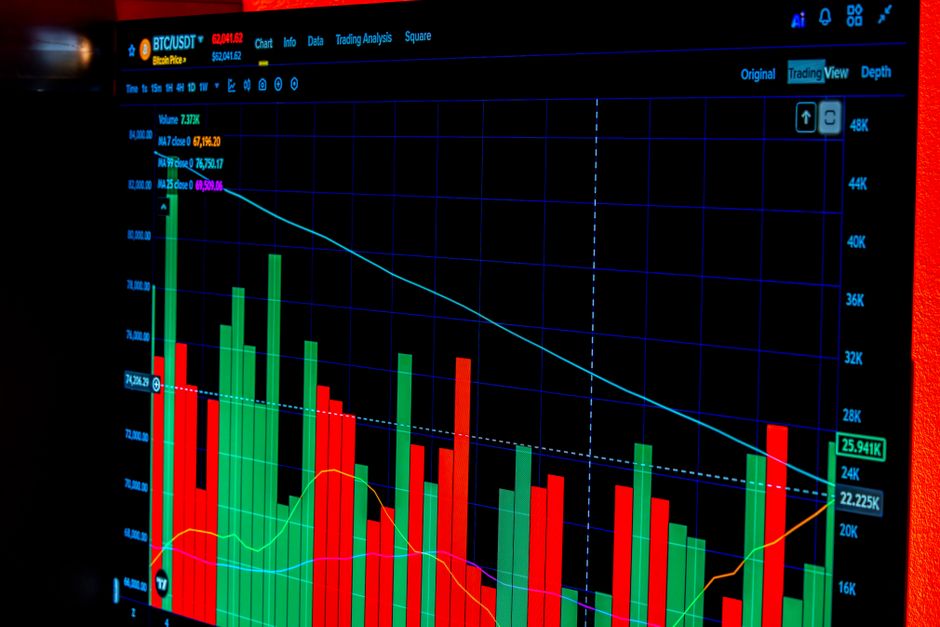
The choice of timeframe dictates the granularity of the data. A 15 minute range captures broader swings but often misses the specific micro-movements that trigger stops. Conversely, a 5 minute view provides high resolution for observing how price reacts immediately after the cash open. Data gathered from the thirty minute range offers a middle ground for assessing whether the initial volatility is a trap or a genuine trend. Every minute of the first hour carries different weight. The discrepancy between the initial volatility and the eventual direction defines the risk profile of the setup. A small sample of trades with high excursion reveals a lack of precision in the entry mechanism.
Correlation Between Excursion and Exit Timing
High adverse excursion often leads to premature exits. If the price moves significantly against a position during the opening bell, the psychological pressure often forces a close before the trend develops. Tracking the ratio of excursion to total profit helps determine if the strategy requires wider stops or better entry timing. A trade that goes deep into the red before returning to profit is more expensive to execute than a clean move. This cost is not just the monetary loss, but the increased capital requirement to survive the volatility of the market open.
Mechanical Implementation of Measurement
Execution requires recording the entry price, the maximum unfavorable price reached, and the final exit price. This process must be applied to every trade during regular trading hours. Comparing the excursion against the total range of the day provides a percentage-based metric for risk. If the excursion is consistently a large portion of the daily range, the entry is poorly timed. Systematic logging of these variables removes the bias of looking only at the closing bell results. The math dictates the strategy adjustments.